29 KiB
🇷🇺 Русская версия | 🇵🇱 Polska wersja
Atomic Threat Coverage
Actionable analytics designed to combat threats based on MITRE's ATT&CK.
Atomic Threat Coverage is tool which allows you to automatically generate actionable analytics, designed to combat threats (based on the MITRE ATT&CK adversary model) from Detection, Response, Mitigation and Simulation perspectives:
- Detection Rules based on Sigma — Generic Signature Format for SIEM Systems
- Data Needed to be collected to produce detection of specific Threat
- Logging Policies need to be configured on data source to be able to collect Data Needed
- Enrichments for specific Data Needed which required for some Detection Rules
- Triggers based on Atomic Red Team — detection tests based on MITRE's ATT&CK
- Response Playbooks based on atc-react — Security Incident Response Playbooks for reacting on specific Threat
- Mitigation Policies based on atc-mitigation need to be deployed and/or configured to mitigate specific Threat
- Visualisations for creating Threat Hunting / Triage Dashboards
- Customers of the analytics — could be internal or external. This entity needed to tracking the implementation
Atomic Threat Coverage is highly automatable framework for accumulation, development and sharing actionable analytics.
Description
Atomic Threat Coverage is a framework that provides you with ability to automatically generate Confluence and Markdown knowledge bases (as well as the other analytics), with a mapping of different entities to each other using MITRE ATT&CK techniques IDs.
Here are links to our demo environment where you can see the outcome of the framework usage:
- Automatically generated Atlassian Confluence knowledge base
- Automatically generated Markdown knowledge base
- Automatically generated Kibana dashboard (user: demo, password: password).
Motivation
There are plenty decent projects which provide analytics (or functionality) of specific focus (i.e. Sigma - Detection, Atomic Red Team - Simulation, etc). All of them have one weakness — they exist in the vacuum of their area. In reality everything is tightly connected — data for alerts doesn't come from nowhere, and generated alerts don't go nowhere. Data collection, security systems administration, threat detection, incident response etc are parts of bigger and more comprehensive process which requires close collaboration of various departments.
Sometimes problems of one function could be solved by methods of other function in a cheaper, simpler and more efficient way. Most of the tasks couldn't be solved by one function at all. Each function is based on abilities and quality of others. There is no efficient way to detect and respond to threats without proper data collection and enrichment. There is no efficient way to respond to threats without understanding of which technologies/systems/measures could be used to block specific threat. There is no reason to conduct penetration test or Red Team exercise without understanding of abilities of processes, systems and personal to combat cyber threats. All of these require tight collaboration and mutual understanding of multiple departments.
In practice there are difficulties in collaboration due to:
- Absence of common threat model/classification, common terminology and language to describe threats
- Absence common goals understanding
- Absence of simple and straightforward way to explain specific requirements
- Difference in competence level (from both depth and areas perspectives)
That's why we decided to create Atomic Threat Coverage — project which connects different functions/processes under unified Threat Centric methodology (Lockheed Martin Intelligence Driven Defense® aka MITRE Threat-based Security), threat model (MITRE ATT&CK) and provide security teams an efficient tool for collaboration on one main challenge — combating threats.
Why Atomic Threat Coverage
Work with existing [1][2][3][4] analytics/detections repositories looks like endless copy/pasting job, manual adaptation of the information into internal analytics knowledge base format, detections data model, mappings to internal valuable metrics and entities etc.
We decided to make it different.
Atomic Threat Coverage is a framework which allows you to create and maintain your own analytics repository, import analytics from other projects (like Sigma, Atomic Red Team, as well as private forks of these projects with your own analytics) and do export into human-readable wiki-style pages in two (for now) platforms:
- Atlassian Confluence pages (here is the demo of automatically generated knowledge base)
- This repo itself — automatically generated markdown formated wiki-style pages
In other words, you don't have to work on data representation layer manually, you work on meaningful atomic pieces of information (like Sigma rules), and Atomic Threat Coverage will automatically create analytics database with all entities, mapped to all meaningful, actionable metrics, ready to use, ready to share and show to leadership, customers and colleagues.
How it works
Everything starts from Sigma rule and ends up with human-readable wiki-style pages and other valuable analytics. Atomic Threat Coverage parses it and:
- Maps Detection Rule to ATT&CK Tactic and Technique using
tagsfrom Sigma rule - Maps Detection Rule to Data Needed using
logsourceanddetectionsections from Sigma rule - Maps Detection Rule to Triggers (Atomic Red Team tests) using
tagsfrom Sigma rule - Maps Detection Rule to Enrichments using references inside Detection Rule
- Maps Response Playbooks to ATT&CK Tactic and Technique using references inside Response Playbooks
- Maps Response Actions to Response Playbooks using references inside Response Playbooks
- Maps Logging Policies to Data Needed using references inside Data Needed
- Maps Detection Rules, Data Needed and Logging Policies into Customers using references inside Customers entity
- Converts everything into Confluence and Markdown wiki-style pages using jinja templates (
scripts/templates) - Pushes all pages to local repo and Confluence server (according to configuration provided in
scripts/config.yml) - Creates Elasticsearch index for visualisation and analysis of existing data in Kibana
- Creates ATT&CK Navigator profile for visualisation of current detection abilities per Customer
- Creates TheHive Case Templates, build on top of Response Playbooks
- Creates
analytics.csvandpivoting.csvfiles for simple analysis of existing data - Creates Dashboards json files for uploading to Kibana
Under the hood
Data in the repository:
├── analytics/
│   ├── generated/
│   │   ├── analytics.csv
│   │   ├── pivoting.csv
│   │   ├── atc_es_index.json
│   │   ├── thehive_templates/
│   │   │   └── RP_0001_phishing_email.json
│   │   └── attack_navigator_profiles/
│   │   │   ├── atc_attack_navigator_profile.json
│   │   │   ├── atc_attack_navigator_profile_CU_0001_TESTCUSTOMER.json
│   │   │   └── atc_attack_navigator_profile_CU_0002_TESTCUSTOMER2.json
│   │   └── visualizations/
│   │   │   └── os_hunting_dashboard.json
│   └── predefined/
│   │   ├── atc-analytics-dashboard.json
│   │   ├── atc-analytics-index-pattern.json
│   │   └── atc-analytics-index-template.json
├── customers/
│   ├── CU_0001_TESTCUSTOMER.yml
│   ├── CU_0002_TESTCUSTOMER2.yml
│   └── customer.yml.template
├── data_needed/
│   ├── DN_0001_4688_windows_process_creation.yml
│   ├── DN_0002_4688_windows_process_creation_with_commandline.yml
│   └── dataneeded.yml.template
├── detection_rules/
│   └── sigma/
├── enrichments/
│   ├── EN_0001_cache_sysmon_event_id_1_info.yml
│   ├── EN_0002_enrich_sysmon_event_id_1_with_parent_info.yaml
│   └── enrichment.yml.template
├── logging_policies/
│   ├── LP_0001_windows_audit_process_creation.yml
│   ├── LP_0002_windows_audit_process_creation_with_commandline.yml
│   └── loggingpolicy_template.yml
├── response
│   └── atc-react/
├── mitigation
│   └── atc-mitigation/
├── triggers/
│   └── atomic-red-team/
└── visualizations/
    ├── dashboards/
    │   ├── examples/
    │   │   └── test_dashboard_document.yml
    │   └── os_hunting_dashboard.yml
    └── visualizations/
        ├── examples/
        │   └── vert_bar.yml
        └── wmi_activity.yml
Detection Rule
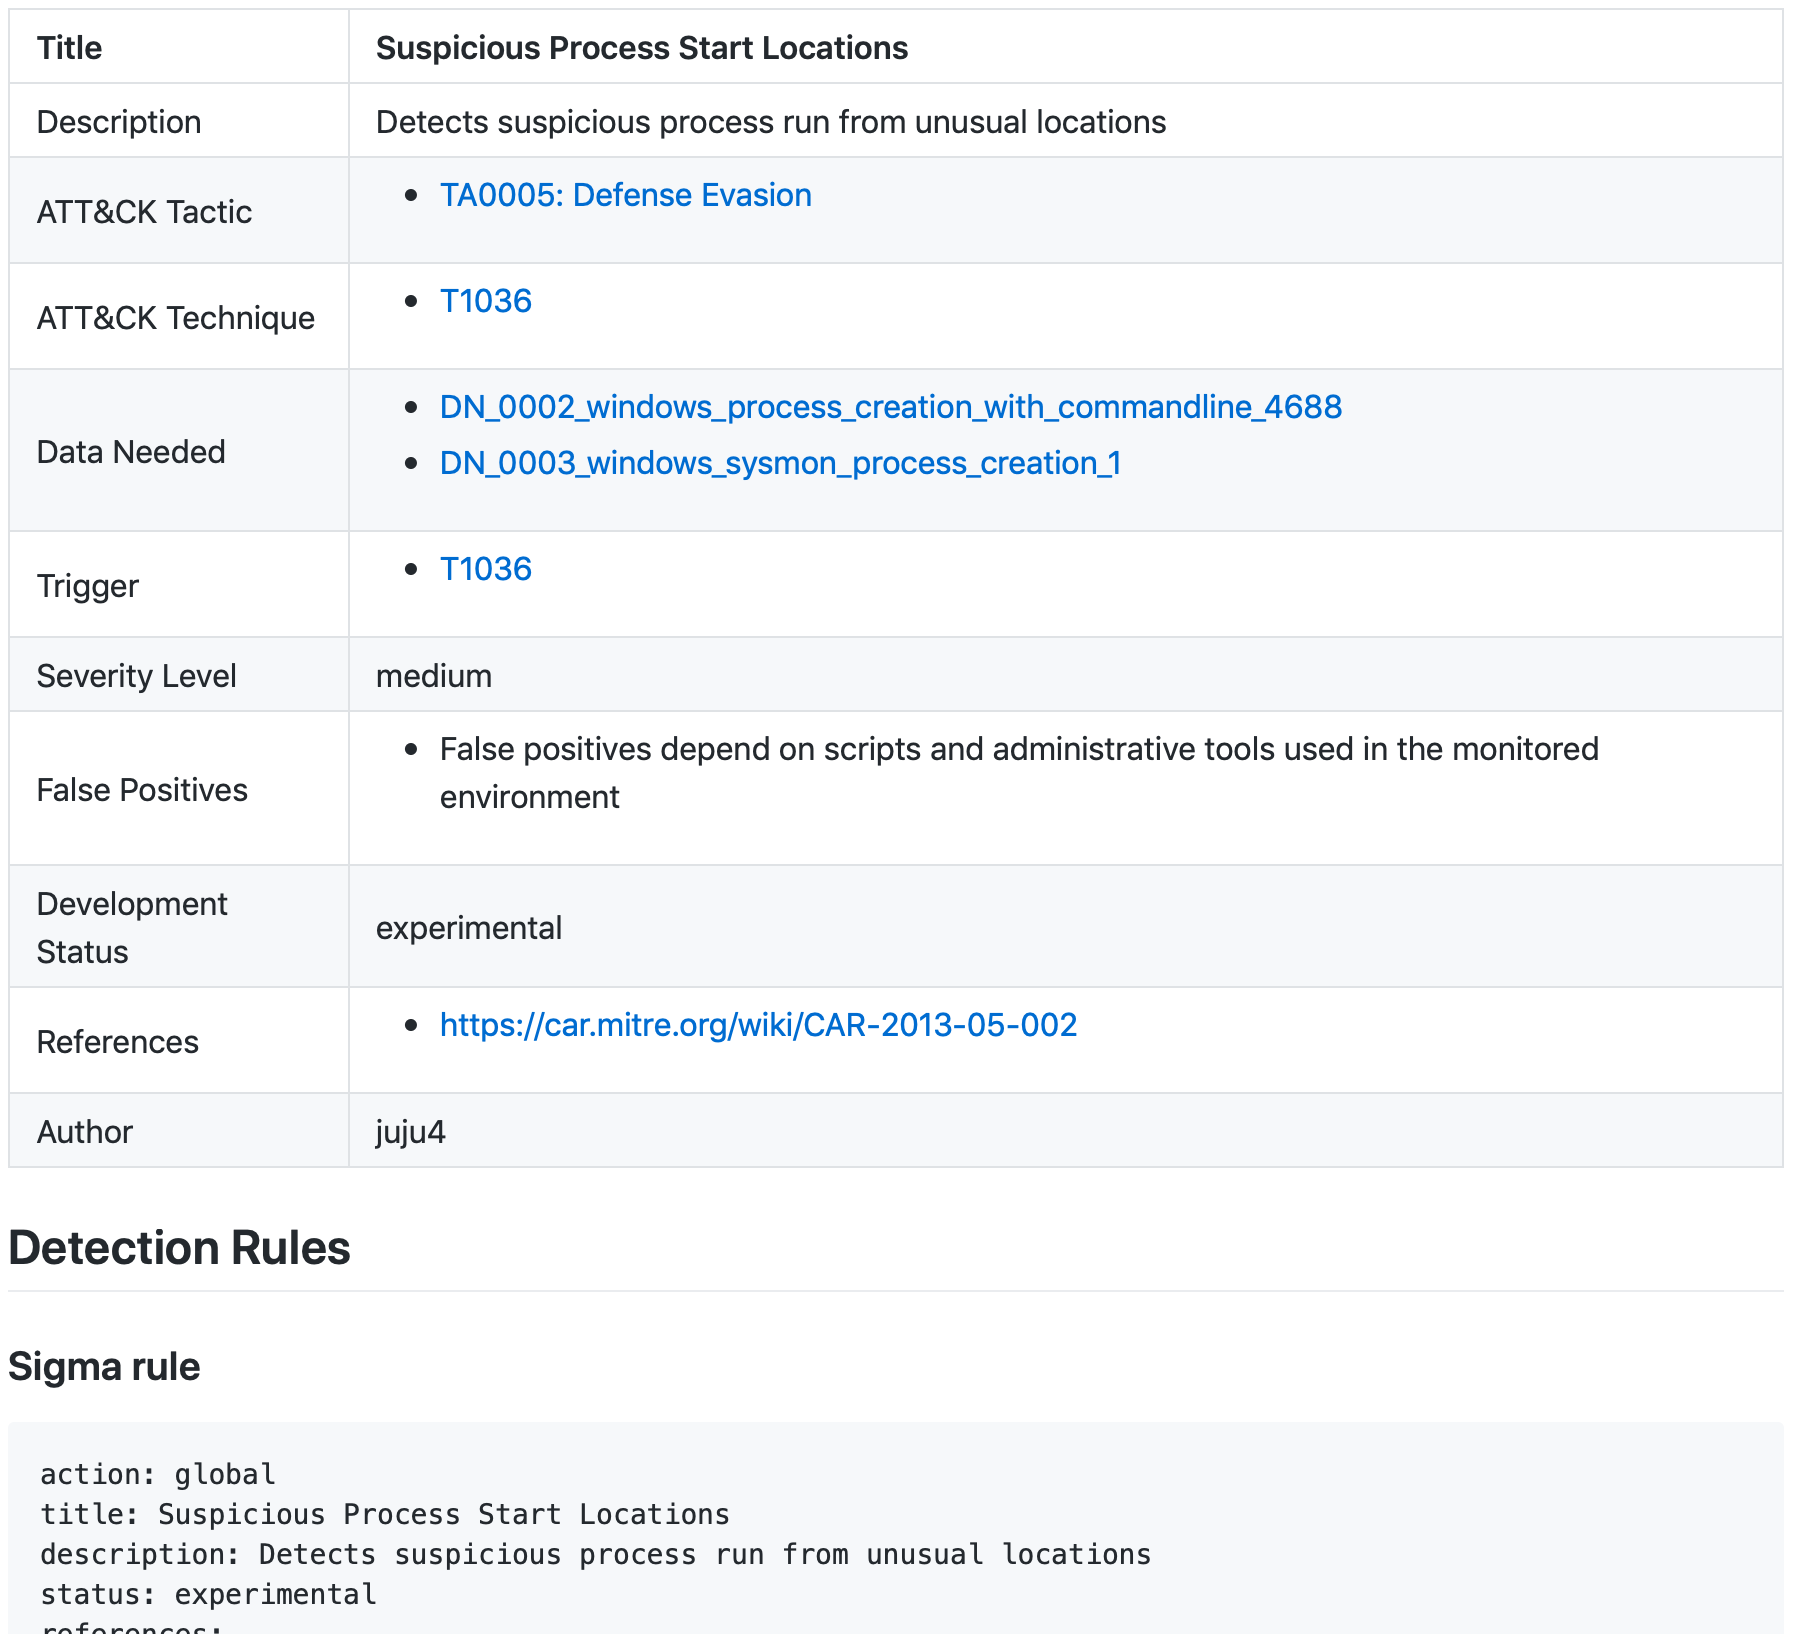
Detection Rules are unmodified Sigma rules. By default Atomic Threat Coverage uses rules from official repository but you can (should) use rules from your own private fork with analytics relevant for you.
Links to Data Needed, Trigger, and articles in ATT&CK are generated automatically. Sigma rule, Kibana query, X-Pack Watcher and GrayLog query generated and added automatically (this list could be expanded and depends on Sigma Supported Targets)
Data Needed
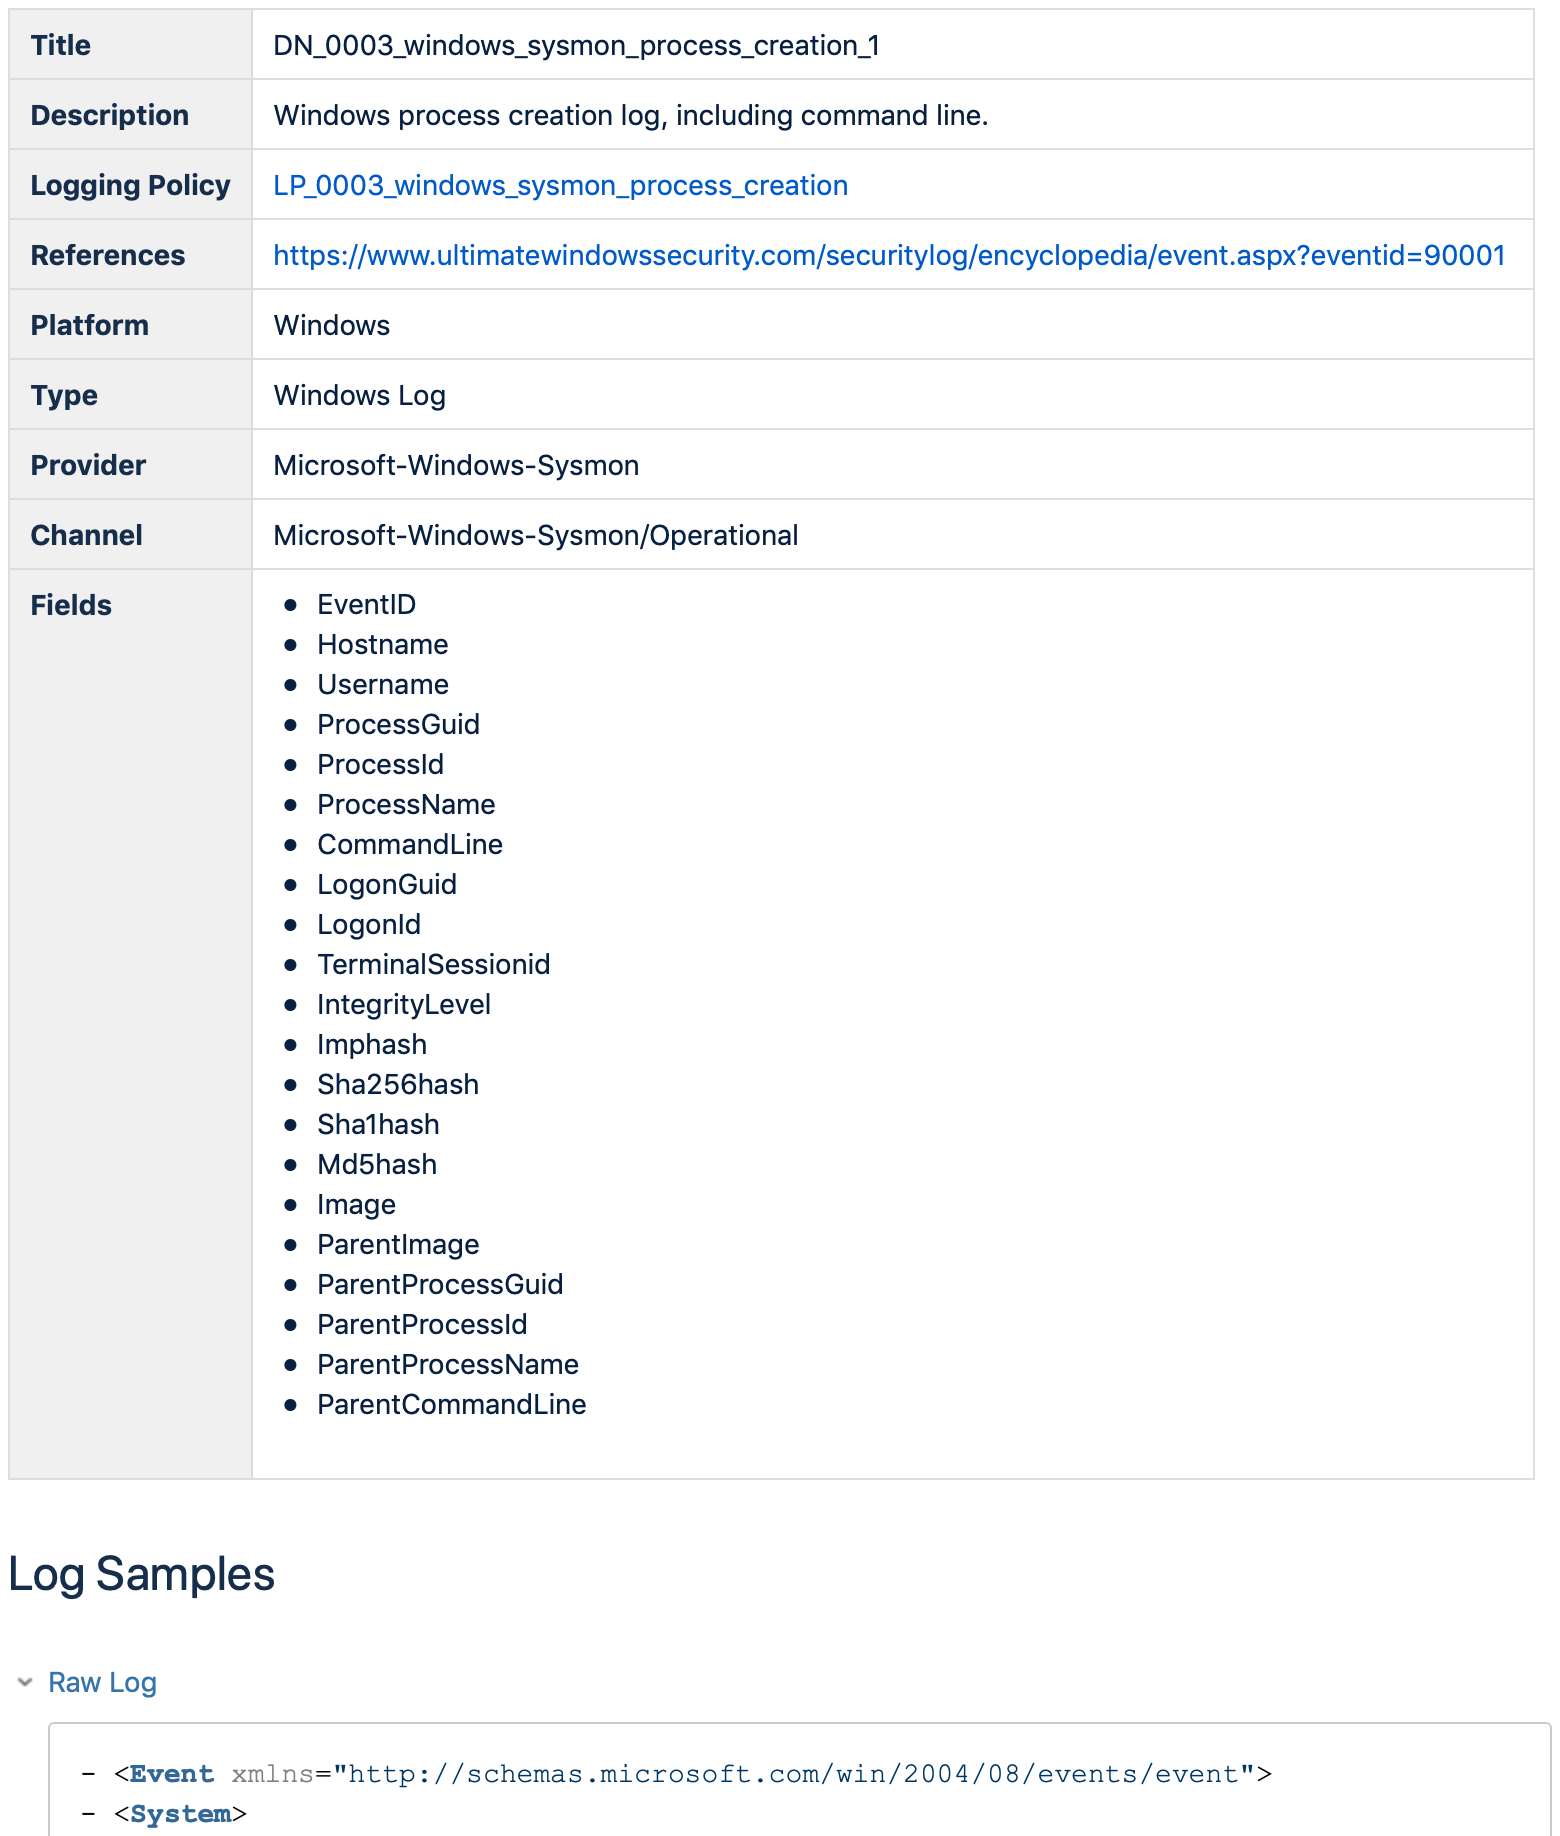
This entity expected to simplify communication with SIEM/LM/Data Engineering teams. It includes the next data:
- Sample of the raw log to describe what data they could expect to receive/collect
- Description of data to collect (Platform/Type/Channel/etc) — needed for calculation of mappings to Detection Rules and general description
- List of fields also needed for calculation of mappings to Detection Rules and Response Playbooks, as well as for
pivoting.csvgeneration
Logging Policy
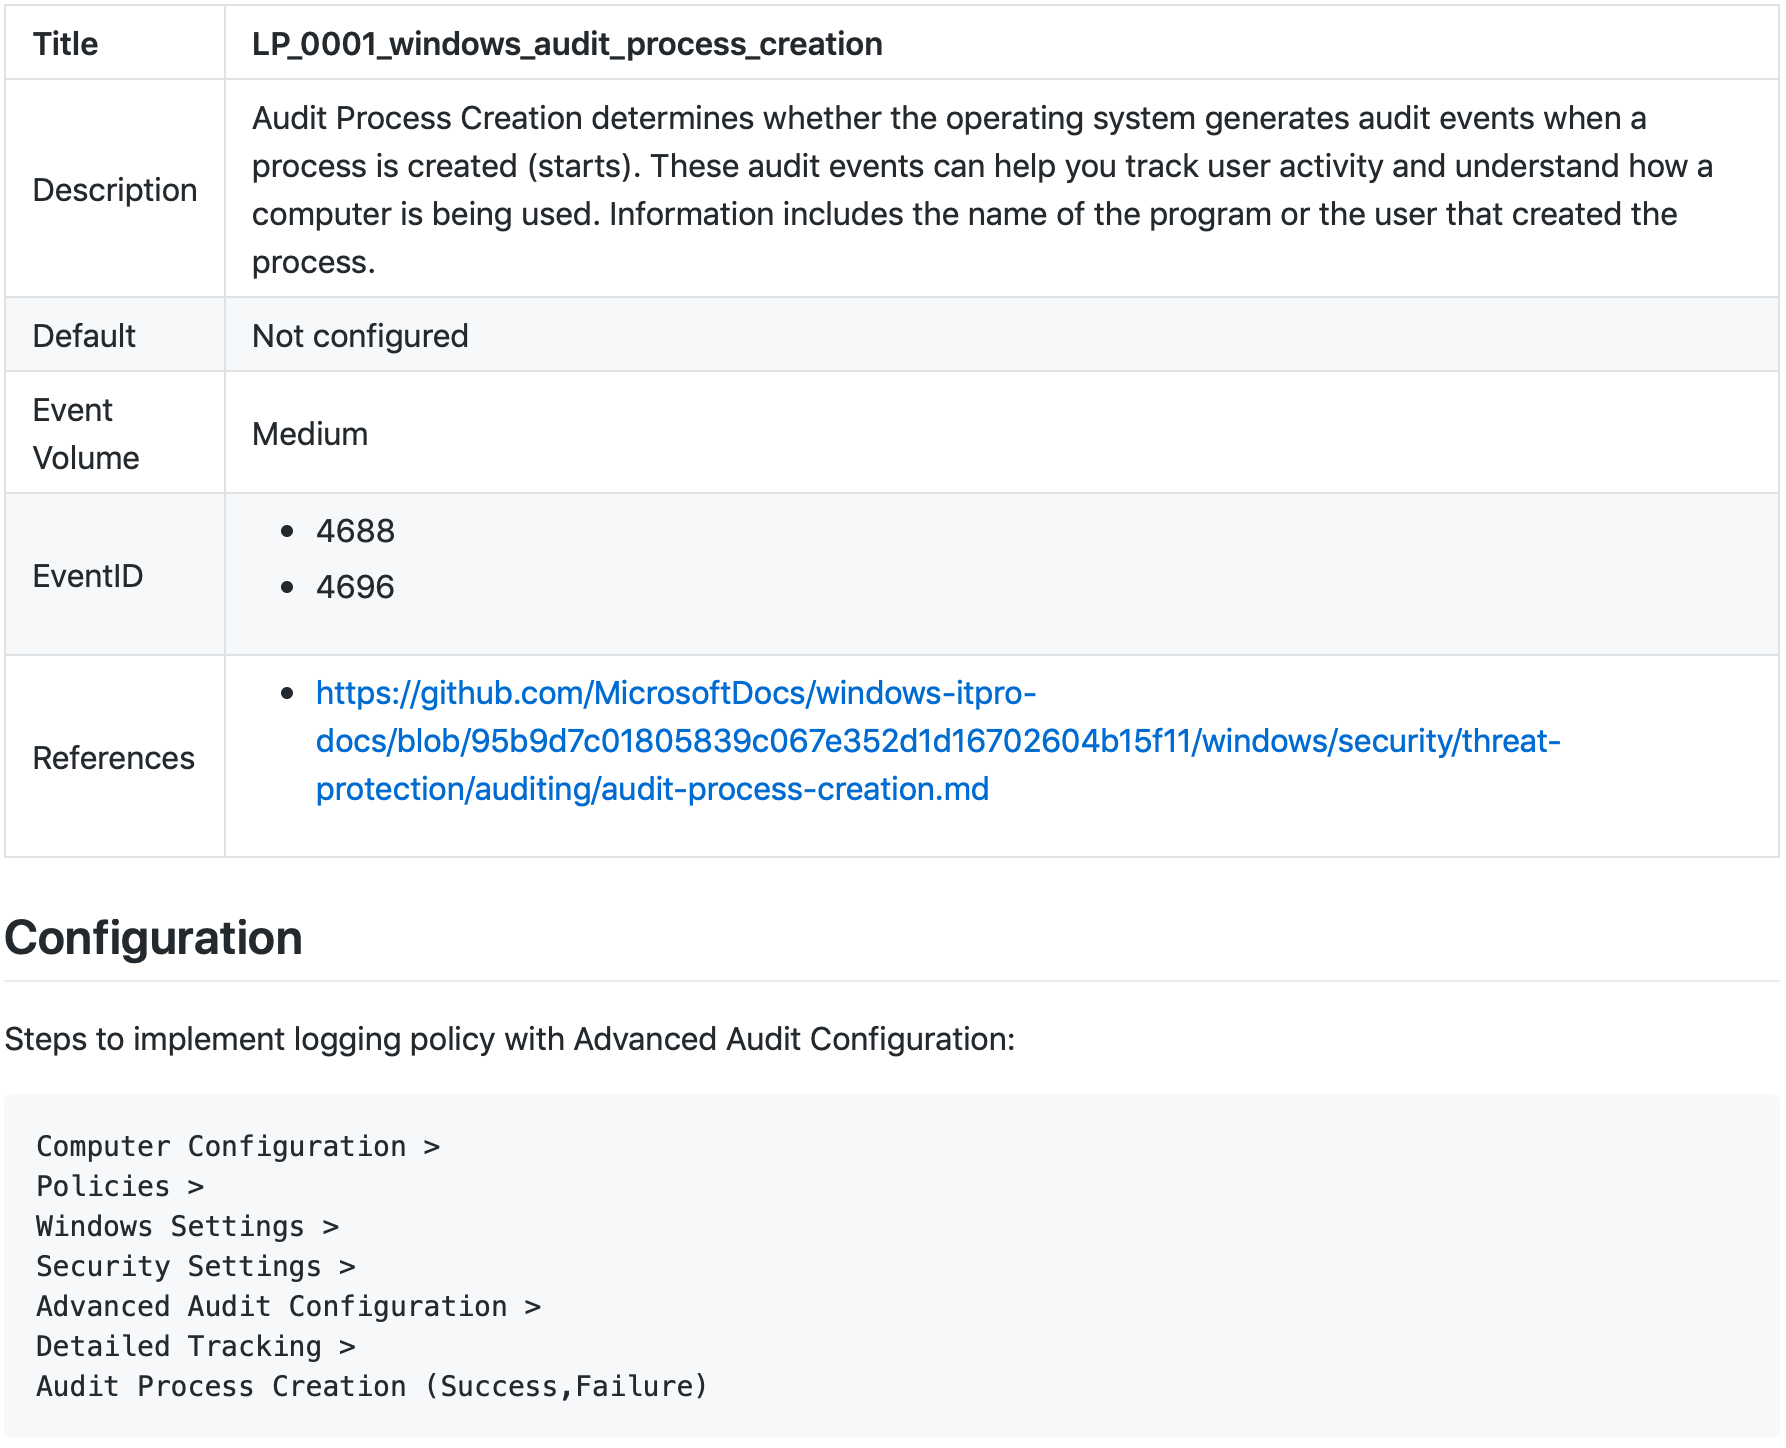
This entity expected to explain SIEM/LM/Data Engineering teams and IT departments which logging policies have to be configured to have proper Data Needed for Detection and Response to specific Threat. It also explains how exactly this policy can be configured.
Enrichment
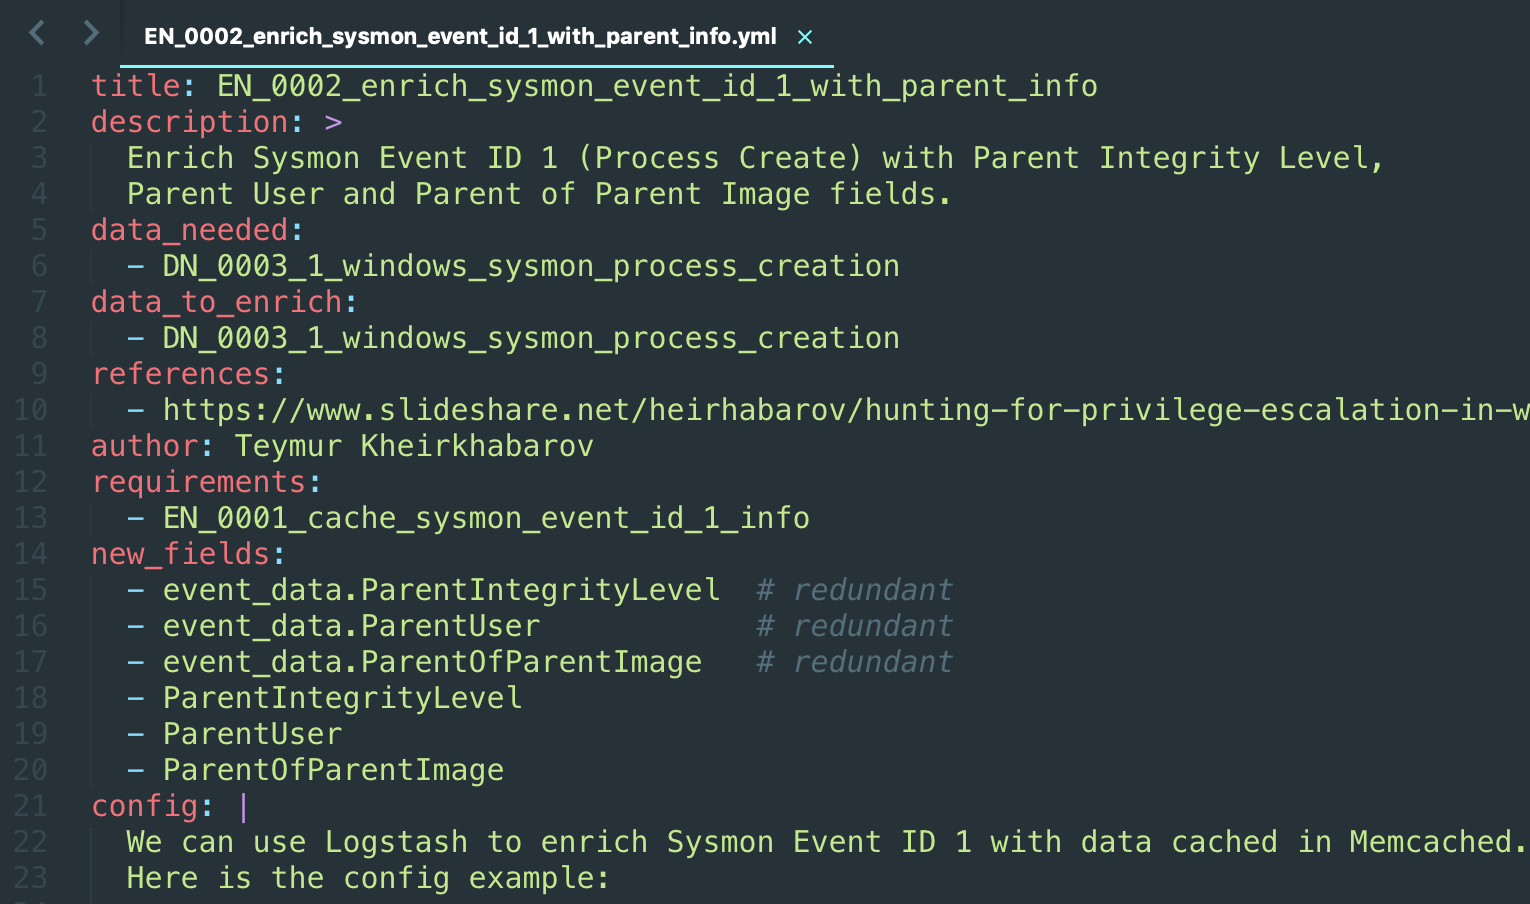
This entity expected to simplify communication with SIEM/LM/Data Engineering teams. It includes the next data:
- List of Data Needed which could be enriched
- Description of the goal of the specific Enrichment (new fields, translation, renaming etc)
- Example of implementation (for example, Logstash config)
This way you will be able to simply explain why you need specific enrichments (mapping to Detection Rules) and specific systems for data enrichment (for example, Logstash).
Customer
This entity used to track Logging Policies configuration, Data Needed collection and Detection Rules implementation per customer. Customer could be internal (for example, remote site) or external (in case of Service Providers). It even could be a specific host. There are no limitations for definition of the entity.
This entity expected to simplify communication with SIEM/LM/Data Engineering teams, provide visibility on implementation for Leadership. It used to generate analytics.csv, atc_attack_navigator_profile.json (per customer) and atc_es_index.json.
Triggers
Triggers are unmodified Atomic Red Team tests. By default Atomic Threat Coverage uses atomics from official repository but you can (should) use atomics from your own private fork with analytics relevant for you.
This entity needed to test specific technical controls and detections. Detailed description could be found in official site.
Mitigation Policy
is a measure that has to be executed to mitigate a specific threat. For more information, please refer to the atc-mitigation repository.
Response Playbook
is an Incident Response plan that represents a complete list of procedures/tasks that has to be executed to respond to a specific threat. For more information, please refer to the atc-react repository.
Visualization
Visualisations include separate Visualisations / Saved searches and Dashboards, built on top of them.
Basically, atomic visualisations represent building blocks for Dashboards of different purposes.
For now we only support export to Kibana. But we are targeting multiple platforms export (Splunk being the nearest future).
This entity could be described as a Sigma for Visualisations.
Detailed HowTo could be found here.
atc_es_index.json
Atomic Threat Coverage generates Elasticsearch index with all data mapped to each other for visualisation and analysis of existing data in Kibana. Demo of the ATC Analytics Dashboard builded upon public Sigma rules available here (user: demo, password: password).
This way it can help to answer these questions:
- What data do I need to collect to detect specific threats?
- Which Logging Policies do I need to implement to collect the data I need for detection of specific threats?
- Which data provided me most of the high fidelity alerts? (prioritisation of data collection implementation)
- etc
Ideally, these visualisations could provide organizations with the ability to connect Threat Coverage from detection perspective to money. Like:
- if we will collect all Data Needed from all hosts for all Detection Rules we have it would be X Events Per Second (EPS) (do calculation for a couple of weeks or so) with these resources for storage/processing (some more or less concrete number)
- if we will collect Data Needed only for high fidelity alerts and only on critical hosts, it will be Y EPS with these resources for storage/processing (again, more or less concrete number)
- etc
If you don't have Elasticsearch and Kibana deployed, you can use analytics.csv for the same purposes.
atc_attack_navigator_profile.json
Atomic Threat Coverage generates ATT&CK Navigator common profile (for all existing Detection Rules) as well as per Customer profiles for visualisation of current detection abilities, gap analysis, development prioritisation, planning etc. You only need to upload it to public or (better) private Navigator site, click New Tab -> Open Existing Layer -> Upload from local. Here is how it looks like for default ATC dataset (original Sigma repository rules, Windows only):
analytics.csv
Atomic Threat Coverage generates analytics.csv with list of all data mapped to each other for simple analysis.
It could be used for the same purposes as atc_es_index.json.
pivoting.csv
Atomic Threat Coverage generates pivoting.csv with list of all fields (from Data Needed) mapped to description of Data Needed for very specific purpose — it provides information about data sources where some specific data type could be found, for example domain name, username, hash etc:
At the same time it highlights which fields could be found only with specific enrichments:
Goals
- Evangelize MITRE ATT&CK framework
- Stimulate community to use Sigma and Atomic Red Team projects
- Evangelize threat information sharing
- Automate most of manual work
- Provide information security community framework which will improve communication with other departments, general analytics accumulation, developing and sharing
Workflow
Demo with Docker
If you just want to try it with default dataset, you can use docker:
- Clone the repository or download an archive with it
- Go to the project directory
- Download and update Sigma and Atomic Red Team projects using git submodules:
git submodule init
git submodule update
git submodule foreach git pull origin master
- Copy
scripts/config.default.ymltoscripts/config.yml - Update
scripts/config.ymlwith links to your own Confluence node (following instructions inside the default config) - Build the container using
docker build . -t atc - Run the container using
docker run -it atc - Provide login and password to Confluence node when script will ask for it
That's all. Confluence will be populated with the data and all analytics will be generated on your side (elasticsearch index, csv files, thehive templates, navigator profiles etc).
We do not recommend to use this type of deployment for production.
If you just want to make yourself familiar with final result with default dataset you can also use online demo of automatically generated Confluence knowledge base.
Production use
- Add your own custom Sigma fork to
detection_rulesdirectory - Add your own custom Atomic Red Team fork to
triggeringdirectory - Add Data Needed into
data_neededdirectory (you can create new one using template) - Add Logging Policies into
logging_policiesdirectory (you can create new one using template) - Add Enrichments into
enrichmentsdirectory (you can create new one using template) - Add Customers into
customersdirectory (you can create new one using template) - Add Response Actions into
response_actionsdirectory (you can create new one using template) - Add Response Playbooks into
response_playbooksdirectory (you can create new one using template) - Configure your export settings and paths to analytics using
scripts/config.yml(create it fromscripts/config.default.ymland adjust settings) - Execute
makein root directory of the repository - Provide login and password to Confluence node when script will ask for it
If you want to partially regenerate/update analytics you can investigate Makefile options or scripts/main.py help.
Uploading ATC Analytics Dashboard
You need both Elasticsearch and Kibana up and running (relevant for version 7.3.1).
Define variables:
ELASTICSEARCH_URL="http://<es ip/domain>:<es port>"
KIBANA_URL="http://<kibana ip/domain>:<kibana port>"
USER=""
PASSWORD=""
Then upload index pattern to Kibana:
curl -k --user ${USER}:${PASSWORD} -H "Content-Type: application/json"\
  -H "kbn-xsrf: true"\
  -XPOST "${KIBANA_URL}/api/saved_objects/index-pattern/42272fa0-cde5-11e9-667e-6f37d60dcef0"\
  -d@analytics/predefined/atc-analytics-index-pattern.json
Then upload Dashboard to Kibana:
curl -k --user ${USER}:${PASSWORD} -H "Content-Type: application/json"\
  -H "kbn-xsrf: true"\
  -XPOST "${KIBANA_URL}/api/kibana/dashboards/import?exclude=index-pattern&force=true"\
  -d@analytics/predefined/atc-analytics-dashboard.json
Then upload index to Elasticsearch:
curl -k --user ${USER}:${PASSWORD} -H "Content-Type: application/json"\
  -XPOST "${ELASTICSEARCH_URL}/atc-analytics/_doc/_bulk?pretty"\
  --data-binary @analytics/generated/atc_es_index.json
You can automate index uploading adding last command to Makefile in your private fork.
This way each time you will add new analytics, Dashboard will be automatically updated.
Current Status: Alpha
The project is currently in an alpha stage. It doesn't support all existing Sigma rules (current coverage is ~80%), also have some entities to develop (like Mitigation Systems). We warmly welcome any feedback and suggestions to improve the project.
Requirements
- Unix-like OS or Windows Subsystem for Linux (WSL) (it required to execute
make) - Python 3.7.1
- requests, PyYAML and jinja2 Python libraries
- Render Markdown app for Confluence (free open source)
FAQ
Will my private analytics (Detection Rules, Logging Policies, etc) be transferred somewhere?
No. Only to your confluence node, according to configuration provided in scripts/config.yml. Atomic Threat Coverage doesn't connect to any other remote hosts, you can easily check it.
What do you mean saying "evangelize threat information sharing" then?
We mean that you will use community compatible formats for (at least) Detection Rules (Sigma) and Triggers (Atomic Red Team), and on some maturity level you will (hopefully) have willingness to share some interesting analytics with community. It's totally up to you.
How can I add new Trigger, Detection Rule, or anything else to my private fork of Atomic Threat Coverage?
Simplest way is to follow workflow chapter, just adding your rules into pre-configured folders for specific type of analytics.
More "production" way is to configure your private forks of Sigma and Atomic Red Team projects as submodules of your Atomic Threat Coverage private fork. After that you only will need to configure path to them in scripts/config.yml, this way Atomic Threat Coverage will start using it for knowledge base generation.
Sigma doesn't support some of my Detection Rules. Does it still make sense to use Atomic Threat Coverage?
Absolutely. We also have some Detection Rules which couldn't be automatically converted to SIEM/LM queries by Sigma. We still use Sigma format for such rules putting unsupported detection logic into "condition" section. Later SIEM/LM teams manually create rules based on description in this field. ATC is not only about automatic queries generation/documentation, there are still a lot of advantages for analysis. You wouldn't be able to utilise them without Detection Rules in Sigma format.
Contacts
Authors
- Daniil Yugoslavskiy, @yugoslavskiy
- Jakob Weinzettl, @mrblacyk
- Mateusz Wydra, @sn0w0tter
- Mikhail Aksenov, @AverageS
Thanks to
- Igor Ivanov, @lctrcl for collaboration on initial data types and mapping rules development
- Andrey, Polar_Letters for the logo
- Sigma, Atomic Red Team, TheHive and Elastic Common Schema projects for inspiration
- MITRE ATT&CK for making this possible
TODO
- Develop TheHive Case Templates generation based on Response Playbooks
- Develop docker container for the project
- Develop specification for custom ATC data entities (Data Needed, Logging Policies etc)
- Implement "Mitigation Systems" entity
- Implement "Hardening Policies" entity
- Implement new entity — "Visualisation" with Kibana visualisations/dashboards stored in yaml files and option to convert them into curl commands for uploading them into Elasticsearch
Links
[1] MITRE Cyber Analytics Repository
[2] Endgame EQL Analytics Library
[3] Palantir Alerting and Detection Strategy Framework
[4] The ThreatHunting Project
License
See the LICENSE file.


