| .circleci | ||
| .github | ||
| bin | ||
| client | ||
| migrations | ||
| redash | ||
| setup | ||
| tests | ||
| .coveragerc | ||
| .dockerignore | ||
| .editorconfig | ||
| .gitignore | ||
| .restyled.yaml | ||
| CHANGELOG.md | ||
| CONTRIBUTING.md | ||
| cypress.json | ||
| docker-compose.yml | ||
| Dockerfile | ||
| LICENSE | ||
| Makefile | ||
| manage.py | ||
| netlify.toml | ||
| package-lock.json | ||
| package.json | ||
| pytest.ini | ||
| README.md | ||
| requirements_all_ds.txt | ||
| requirements_bundles.txt | ||
| requirements_dev.txt | ||
| requirements_oracle_ds.txt | ||
| requirements.txt | ||
| SECURITY.md | ||
| setup.cfg | ||
| webpack.config.js | ||

Redash is our take on freeing the data within our company in a way that will better fit our culture and usage patterns.
Prior to Redash, we tried to use traditional BI suites and discovered a set of bloated, technically challenged and slow tools/flows. What we were looking for was a more hacker'ish way to look at data, so we built one.
Redash was built to allow fast and easy access to billions of records, that we process and collect using Amazon Redshift ("petabyte scale data warehouse" that "speaks" PostgreSQL). Today Redash has support for querying multiple databases, including: Redshift, Google BigQuery, PostgreSQL, MySQL, Graphite, Presto, Google Spreadsheets, Cloudera Impala, Hive and custom scripts.
Redash consists of two parts:
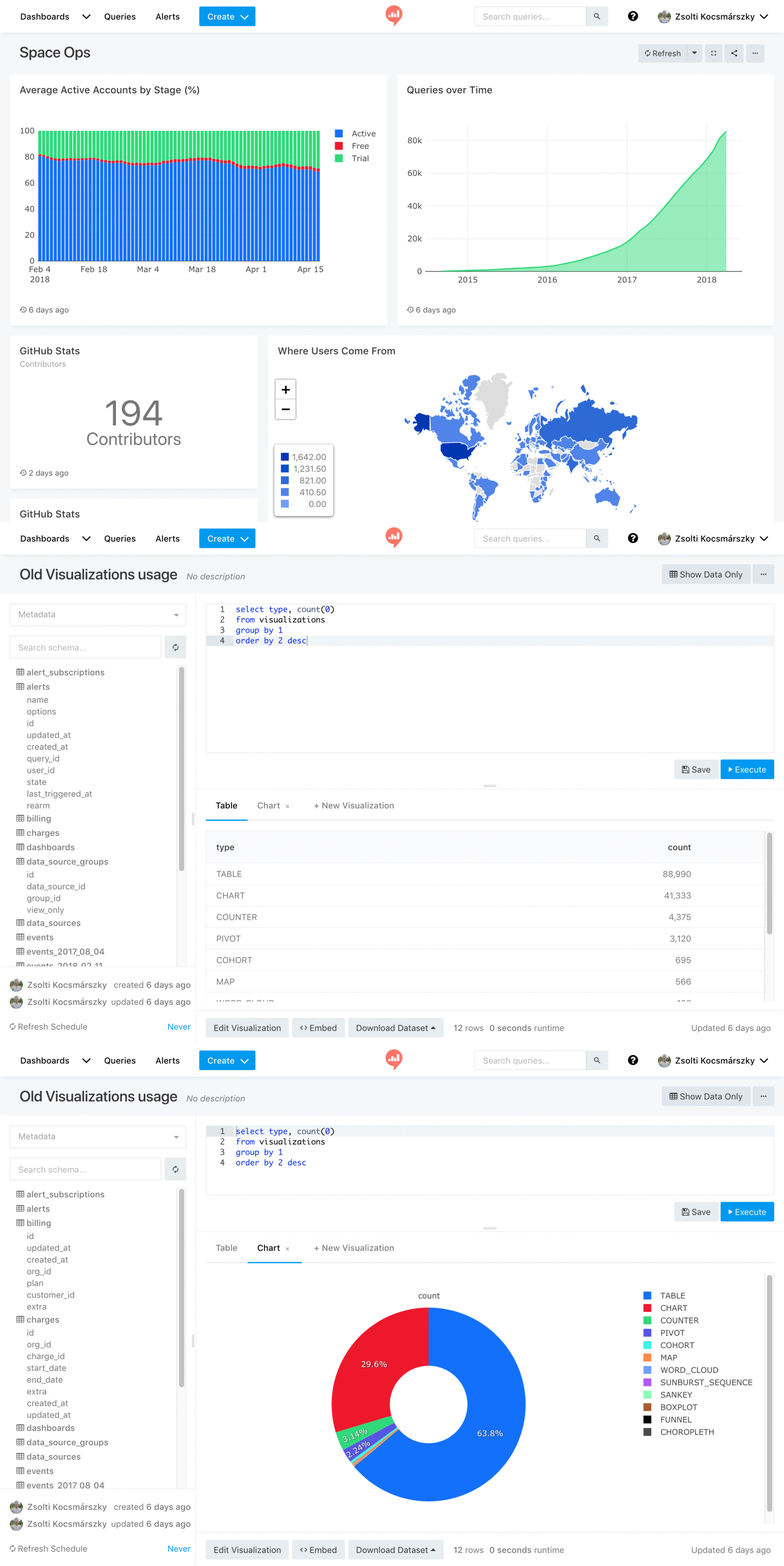
- Query Editor: think of JS Fiddle for SQL queries. It's your way to share data in the organization in an open way, by sharing both the dataset and the query that generated it. This way everyone can peer review not only the resulting dataset but also the process that generated it. Also it's possible to fork it and generate new datasets and reach new insights.
- Visualizations and Dashboards: once you have a dataset, you can create different visualizations out of it, and then combine several visualizations into a single dashboard. Currently Redash supports charts, pivot table, cohorts and more.

Getting Started
- Setting up Redash instance (includes links to ready made AWS/GCE images).
- Documentation.
Supported Data Sources
Redash supports more than 35 data sources.
Getting Help
- Issues: https://github.com/getredash/redash/issues
- Discussion Forum: https://discuss.redash.io/
Reporting Bugs and Contributing Code
- Want to report a bug or request a feature? Please open an issue.
- Want to help us build Redash? Fork the project, edit in a dev environment, and make a pull request. We need all the help we can get!
Security
Please email security@redash.io to report any security vulnerabilities. We will acknowledge receipt of your vulnerability and strive to send you regular updates about our progress. If you're curious about the status of your disclosure please feel free to email us again. If you want to encrypt your disclosure email, you can use this PGP key.
License
BSD-2-Clause.


